Sales
- For
- Manager
- Where
- Back office
- Permission
- View reports
- Checked on
The Sales report gives the revenue, the cost of goods, the gross profit, the margin and the taxes of a period, day by day, week by week or month by month. Four views group them: together, by employee, by item and by hour.
Before you start
Your role needs the View reports permission. Without All sales at assigned stores, the report only counts your own sales.
The cost of goods, the gross profit and the margin require the View purchase costs permission. Without it, those columns do not appear and the page says "Your role does not allow seeing costs: cost, gross profit and margin are not shown."
Showing the sales summary
To read the sales of a period:
Open Reports > Sales.

In Report type, choose By day, By week or By month.
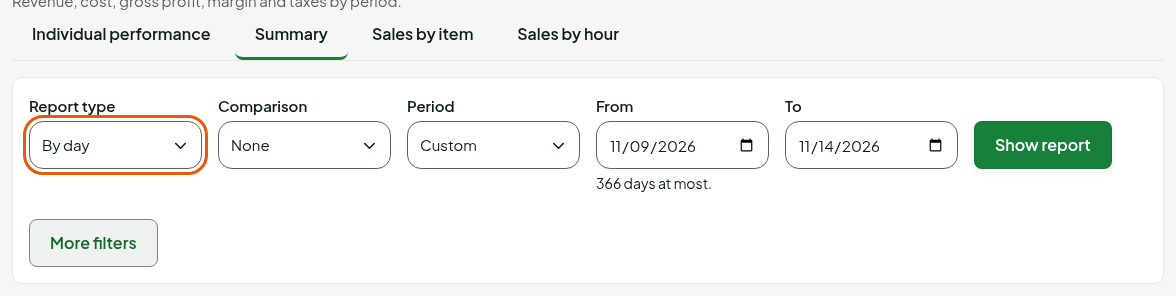
Under Period, choose the period (guide "Choosing the period and the stores of a report").
Click Show report.
The summary is the first tab shown: one row per measure, one column per period, then a Total column.
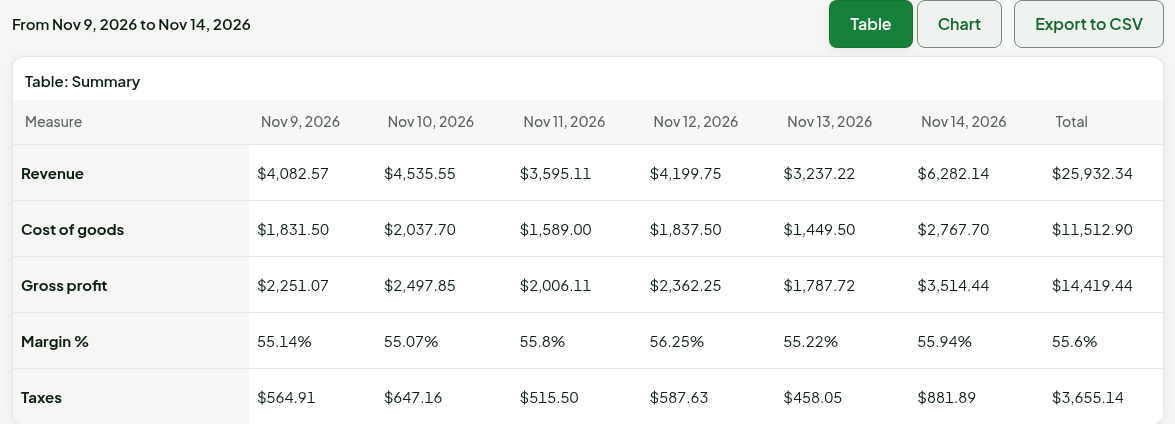
Weeks run from Monday to Sunday. The first and the last period can be partial.
Seeing sales by employee, by item or by hour
To change the view, click a tab. The table keeps the same period and the same period columns.
Click Individual performance.
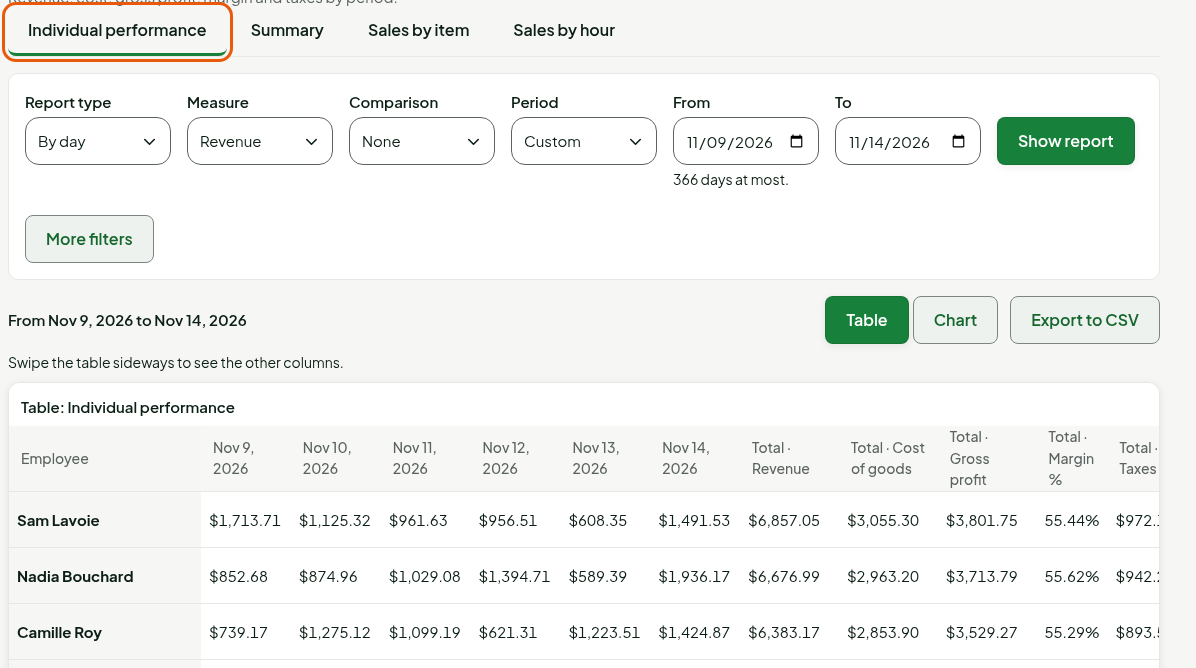
Each row is an employee. The table is sorted by total revenue, from largest to smallest, and ends with a Totals row.
Click Sales by item.
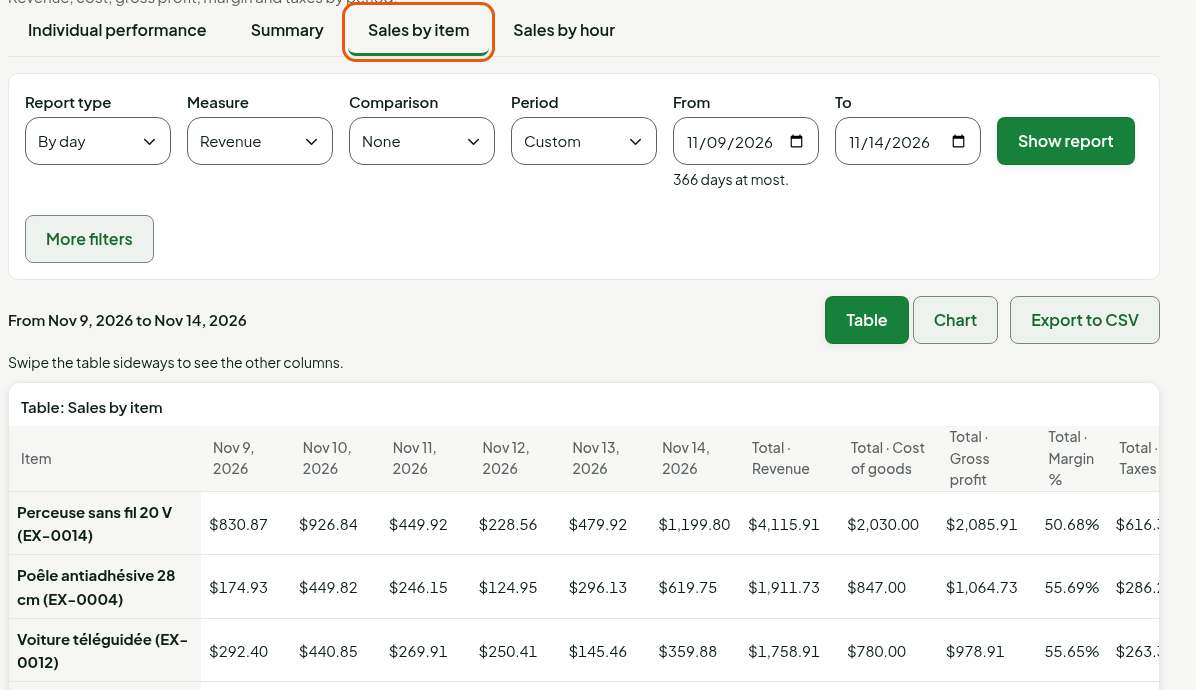
Each row is an item, with its code in parentheses. A sale that is not in the catalogue is listed under "Not in the catalogue".
Click Sales by hour.
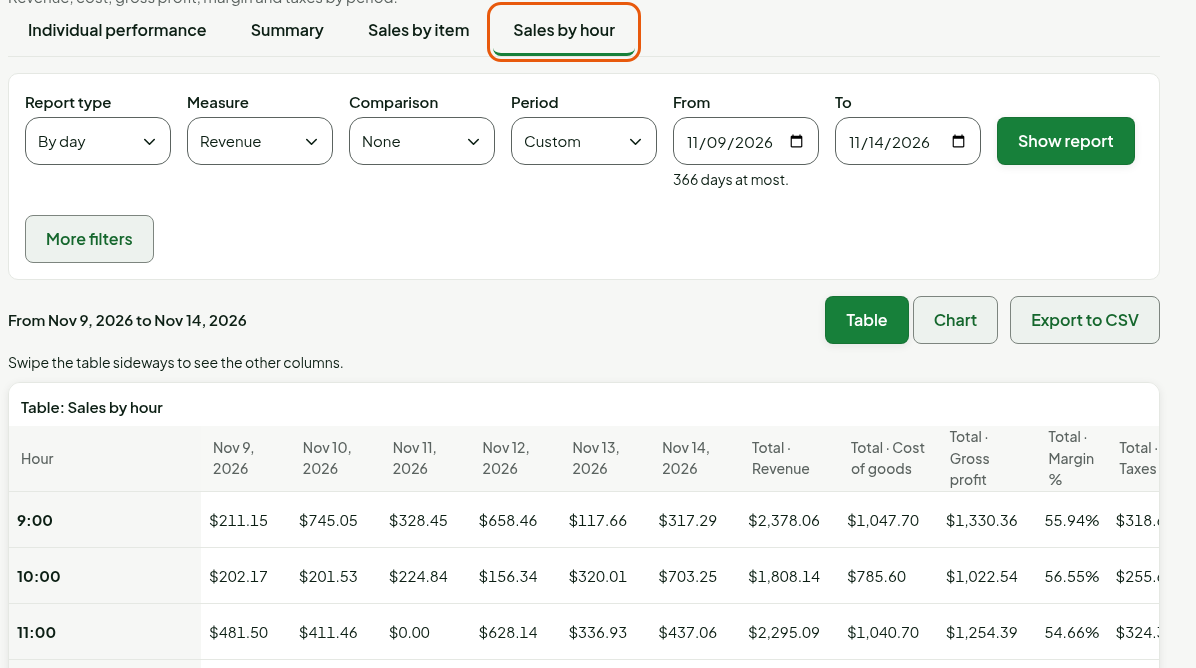
Each row is an hour of the store's day: "9:00" counts the sales made between 9:00 and 9:59.
Choosing the measure
In the three views by employee, item and hour, the period columns show a single measure. The Total columns show all of them.
In Measure, choose Revenue, Cost of goods, Gross profit, Margin % or Taxes.
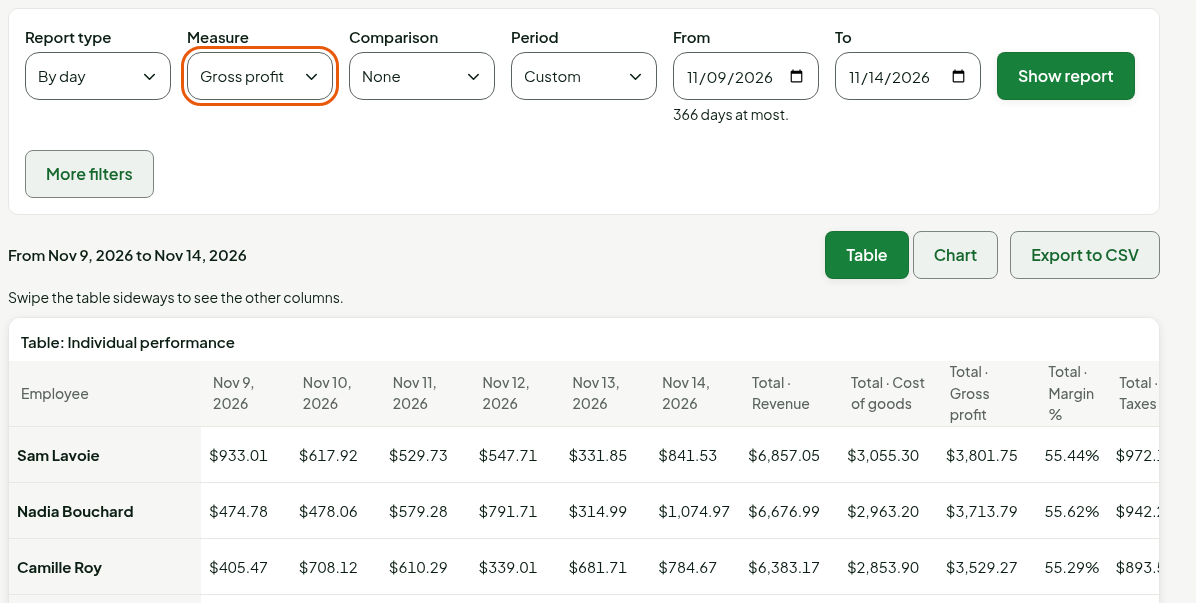
The Measure field does not exist in Summary: there, the rows are the measures.
Comparing with the previous period
To compare a period with the one before it:
In Comparison, choose Previous period.
Click Show report.
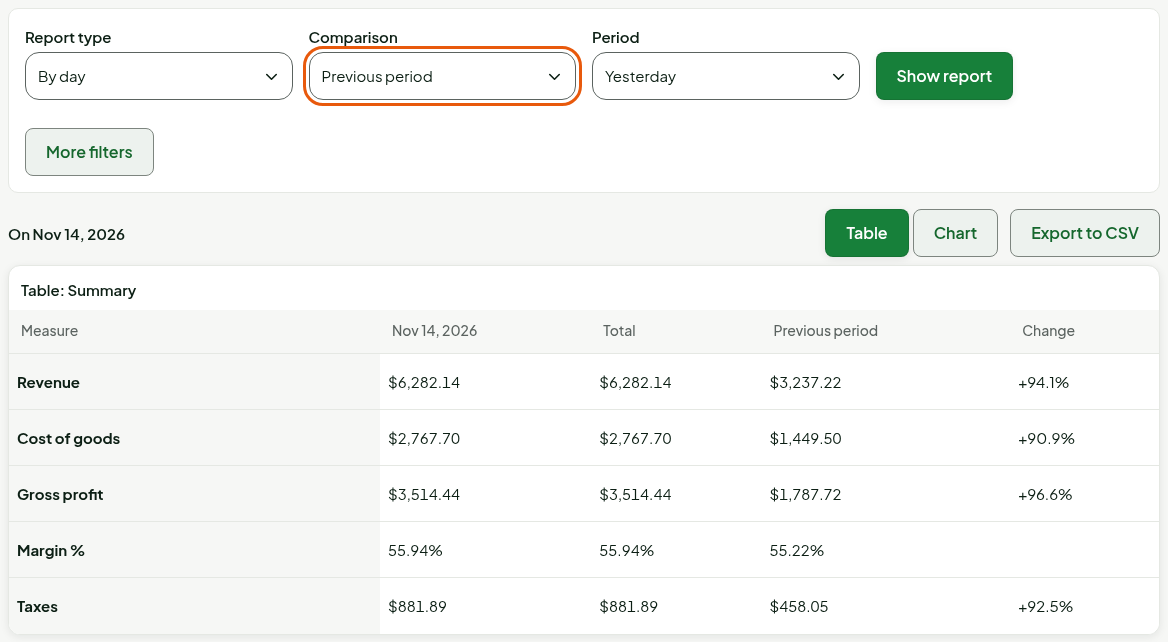
The previous period has the same length and ends the day before the start. Two columns are added: the measure for that period and the Change, as a percentage. Margin % has no change.
Seeing the chart
To see the chosen measure as bars:
Click Chart, above the table.
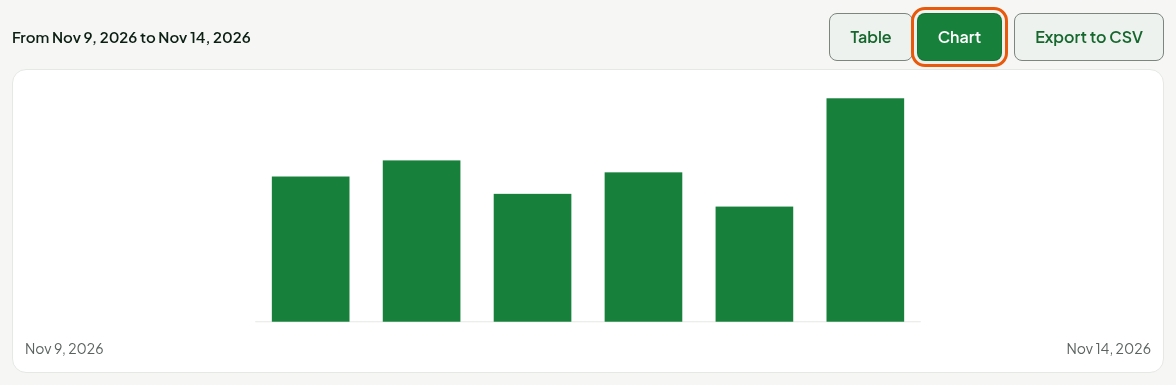
One bar is one period. Click Table to go back to the table. Export to CSV exports the table that is shown (guide "Exporting a report to CSV"). To read a single store, click More filters: the Stores field opens.
Understanding the columns
| Measure | What it shows |
|---|---|
| Revenue | Sales after discounts, minus returns, excluding taxes. |
| Cost of goods | The cost of the items sold, as recorded. A message warns when the cost of some sales is missing: cost, gross profit and margin are then incomplete. |
| Gross profit | Revenue minus the cost of goods. |
| Margin % | Gross profit divided by revenue. |
| Taxes | The taxes collected on sales, minus those refunded on returns. |
| Total | The sum of the periods. |
For the same period, the Taxes of this report are the net tax of the total of the Taxes collected report: the two reports agree to the cent.
Troubleshooting
"No sale in this period."
Nothing was sold in the period or in the stores you chose. Click Change the criteria and widen the period.