Dashboard
- For
- Manager
- Where
- Back office
- Permission
- View reports, All sales at assigned stores
- Checked on
The dashboard shows the key figures of a day, a week or a month, store by store, and compares them with the previous period. Use it to see at a glance how sales are going, before opening a more detailed report.
Before you start
Your role needs two permissions: View reports and All sales at assigned stores. To see the gross profit, it also needs View purchase costs.
Showing the dashboard
To open the dashboard:
Open Reports > Dashboard.

The dashboard opens on today, for all your stores. The result updates right away when you change a choice: there is no Show report button.
Choosing the view and the period
To read a week or a month:
Click Week or Month, to the left of the arrows.

A week runs from Monday to Sunday. A month is a calendar month.
Click the left arrow to go back one period: the day before, the week before or the month before. The right arrow goes forward.

The date in the middle tells the period that was read. To go to a specific day:
Click More filters.
In Go to date, choose a day.
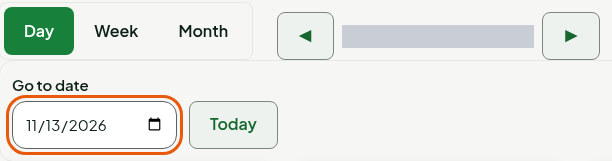
The period that contains that day is shown. The Today button returns to the current period.
Choosing the stores
To read a single store or some of the stores:
Click the Stores field.
Tick the stores you want, or point at a store and click Only this one.
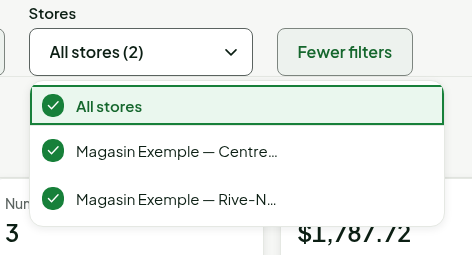
The field only exists if you have access to several stores. The choice of period and stores is kept in the address of the page: copy it to show the same view to someone else.
Reading the cards
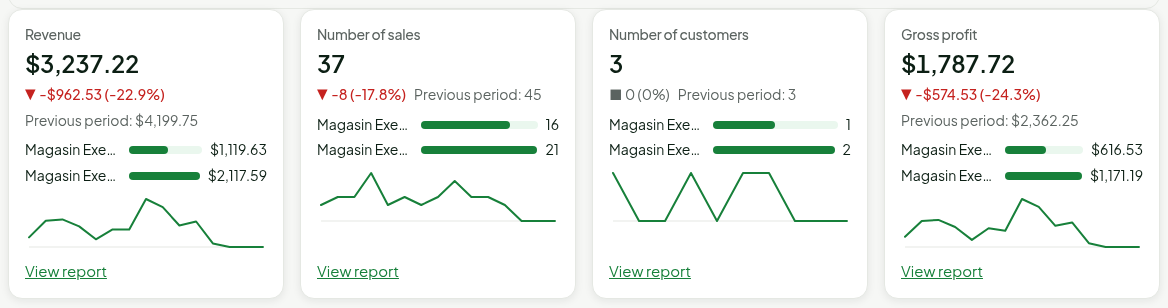
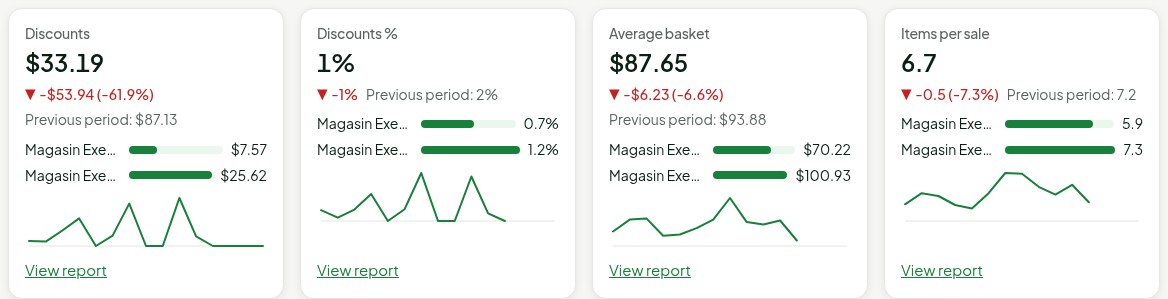
Eight cards give the figures of the period. Each one shows the figure, the difference from the previous period (arrow, sign and percentage), the figure of the previous period, a bar per store and a curve: one value per hour for a day, per day for a week or a month.
| Card | What it shows |
|---|---|
| Revenue | Sales after discounts, minus returns, excluding taxes. |
| Number of sales | The number of sales in the period. |
| Number of customers | The number of different customers identified on the sales. A sale without a customer counts for none. |
| Gross profit | Revenue minus the cost of the goods sold. |
| Discounts | The total of the discounts given. |
| Discounts % | The discounts divided by the amount of sales before discounts. |
| Average basket | The total of sales after discounts, before returns, divided by the number of sales. |
| Items per sale | The items sold divided by the number of sales, with one decimal. |
A week or a month still in progress is compared with the previous period cut at the same number of elapsed days. A finished period is compared in full with the previous one.
In each card, View report opens the Sales report on the same period and the same stores.
Reading the items sold
Under the cards, the Items sold table lists the items of the period with their revenue, the quantity sold, the discounts and the trend. It is sorted by Revenue, from largest to smallest.
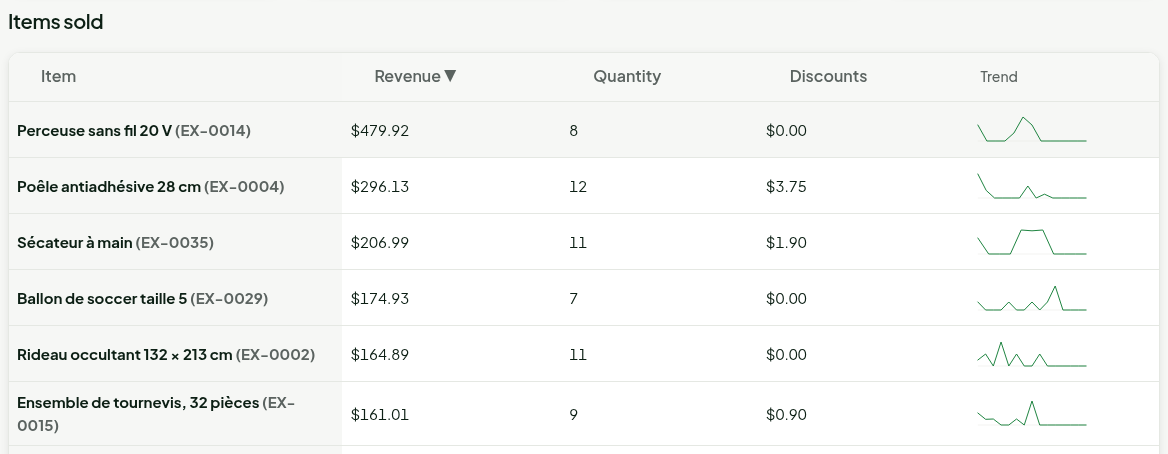
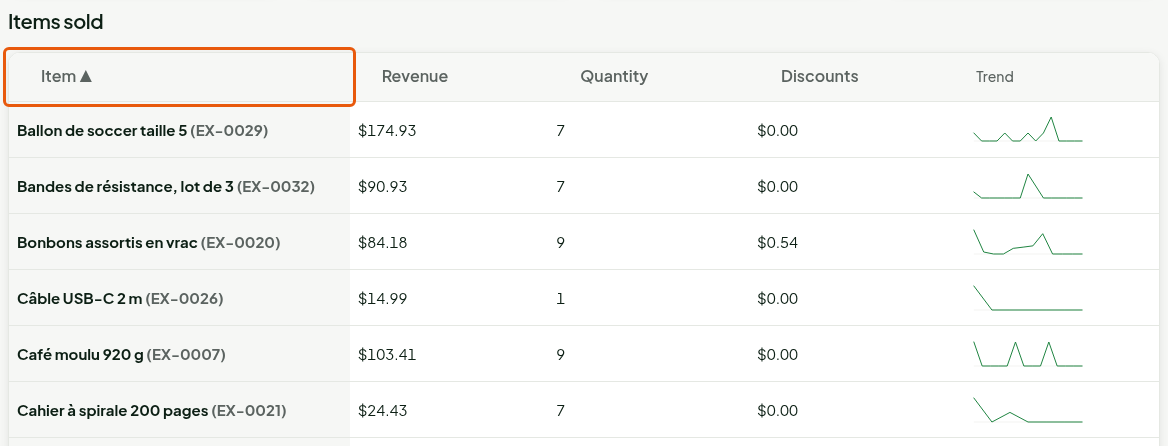
To sort it another way, click a column title (Item, Revenue, Quantity or Discounts); a second click reverses the order.
The table shows the 100 items with the highest revenue and says so under the list when there are more.
Troubleshooting
The gross profit is not shown
Without the View purchase costs permission, the Gross profit card says "Your role does not allow seeing costs." When items sold have no recorded cost, it shows a dash and "Profit unknown: N items without a recorded cost." The profit is never calculated on an incomplete cost.
"No store to show. Check the chosen stores."
No store matches the choice. Open the Stores field and tick at least one store.
"No item sold in this period."
Nothing was sold in the period. Go back or forward with the arrows, or change the view.